


Wonderful Introduction:
Since ancient times, there have been joys and sorrows, and since ancient times, there have been sorrowful moon and sad songs. But we never understood it, and we thought everything was just a distant memory. Because there is no real experience, there is no deep feeling in the heart.
Hello everyone, today Avatrade Aihua Foreign Exchange will bring you "[Aihua Foreign Exchange Platform]: Trump staged a "face-changing show", and the US index approached the 100 mark." Hope it will be helpful to you! The original content is as follows:
On April 24, early trading in the Asian market on Thursday, Beijing time, the US dollar index hovered around 99.75. On Wednesday, as Trump and Becente released optimistic signals in trade negotiations, the U.S. dollar index continued to rebound and finally closed up 0.932% to 99.9. U.S. Treasury yields rose and fell mixed, with the benchmark 10-year U.S. Treasury yields closed at 4.393%; and the two-year U.S. Treasury yields, which are more sensitive to monetary policy, closed at 3.885%. The decline in risk aversion sentiment and the rise in the US dollar caused spot gold to plummet by more than $100, once hitting the $3260 mark, and finally closed down 2.77% to $3288.44 per ounce. As demand outlook boosted, spot silver trends and gold differentiated, and eventually closed up 3.29% at $33.55 per ounce. International crude oil plunged after sources said OPEC+ would consider accelerating its oil production growth in June, but easing of trade tensions has limited its decline. WTI crude oil hit a low of $61.4 per barrel and finally closed down 2.02% at $62.13 per barrel; Brent crude oil closed down 1.81% at $65.24 per barrel.
Analysis of major currencies
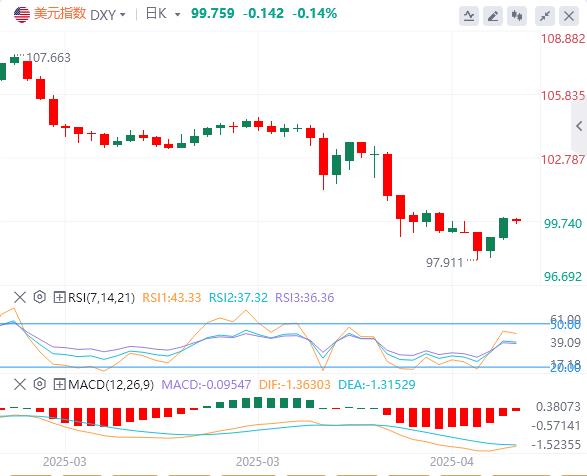
Dollar Index: As of press time, the US dollar index hovers around 99.75. Market volatility stems from remarks by U.S. President Trump, who said he would not fire Fed Chairman Powell (although he expressed dissatisfaction with high interest rate policies). Trump's remarks have caused the market to have certain doubts about US policies, which in turn affects the trend of the US dollar. On the daily chart, https://aihuaforex.comThe trend of the US dollar index shows a certain weakness, with prices not exceeding the 101.00 level above recently and continue to fluctuate in a lower range. Technically, the US dollar index closed above 50MA at 99.39 and tried to close above 99.70. If this attempt is successful, the U.S. dollar index will move towards the next resistance level 100.20–100.40.
1) Analysis of gold market trends
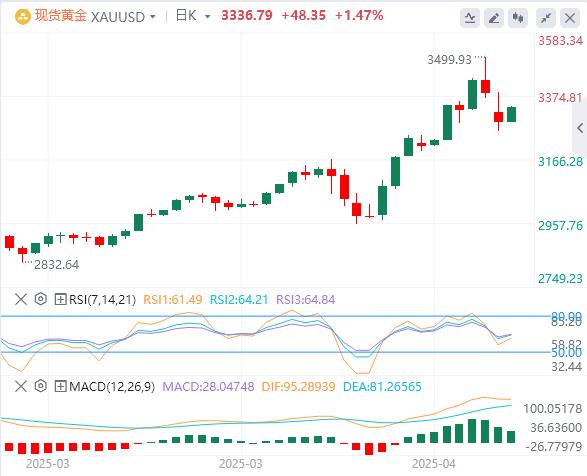
On Thursday, gold trading around 3336.79. Earlier, US President Trump said he did not intend to fire the Federal Reserve Chairman and hinted that it had made progress on tariff issues, investors' appetite for risky assets has improved, the US dollar and US stocks rebounded, suppressing the gold price. After the gold price was blocked at the 3500 mark, more short-term long profit settlement also dragged down the gold price. This trading day will be released on the initial monthly rate of durable goods orders in the United States in March and the number of initial unemployment claims in the United States for the week ending April 19. Investors need to pay attention to it. In addition, we need to continue to pay attention to the relevant news about the international trade situation and geopolitical situation.
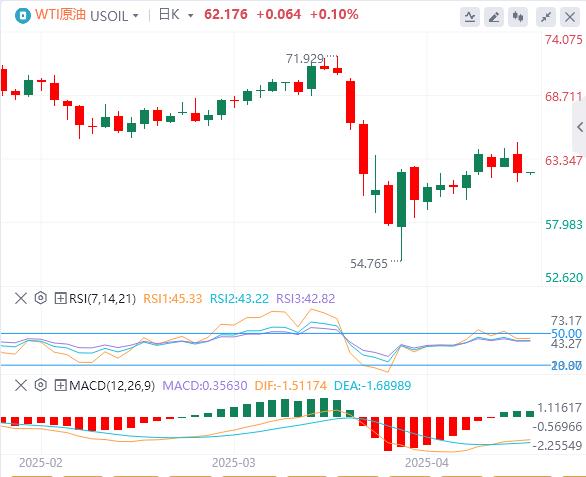
2) Analysis of crude oil market trend
On Thursday, crude oil trading was around 62.18. Market sentiment was boosted by the new round of US sanctions on Iran, and the US Treasury Department announced the core personnel of the network for liquefied petroleum gas and crude oil exports to Iran New sanctions were imposed by Vasaid Asadora Emamjomech and his corporate system. This round of oil price increases reflects the short-term positive for geopolitical and inventory side, but from a structural perspective, the market remains reserved for the demand outlook. Investors need to pay attention to this trading day, and in addition, we need to continue to pay attention to the news about the international trade and geopolitical situation.
Foreign exchange market trading reminder on April 24, 2025
To be determined. G20 Finance and Central Bank Ministerial Meeting was held
15:15France April Manufacturing PMI preliminary value
15:30German April Manufacturing PMI preliminary value
16:00Eurozone April Manufacturing PMI preliminary value
16:30 The initial value of the manufacturing PMI in the UK in April
16:30 The initial value of the service PMI in the UK in April
17:00 The post-season adjustment trade account in the euro zone
21:30 The speeches of the Federal Reserve Mousalem and Waller
21:45 The initial value of the global manufacturing PMI in the US in April
21:45 The initial value of the global service PMI in the US in April
22:00 The total number of new home sales in the US in March
22:30 The US to 4 EIA crude oil inventories in the week of the 18th of the month
22:30 EIA Cushing crude oil inventories in the week of the United States to April 18th
22:30 EIA strategic oil reserve inventories in the week of the United States to April 18th
The next day, the Federal Reserve announced the Beige Book of Economic Conditions
The above content is about "[Ihua Foreign Exchange Platform]: Trump staged a "face-changing show", the US index approached the 100 mark", which was carefully aihuaforex.compiled and edited by the Avatrade Foreign Exchange editor. I hope it will be helpful to your transactions! Thanks for the support!
Every successful person has a beginning. Only by having the courage to start can you find the way to success. Read the next article now!